Network visualization, analysis & design GUI
ENP smart multilayer visualization provides geographical and logical user-defined views of the network topology. The Graphical User Interface (GUI) also allows the user to access multiple network performance metrics, visual insights and analysis of the multilayer interactions, and other tool functionalities, as will be shown in this section.
ENP tool has two main windows, as illustrated in the next Figure:
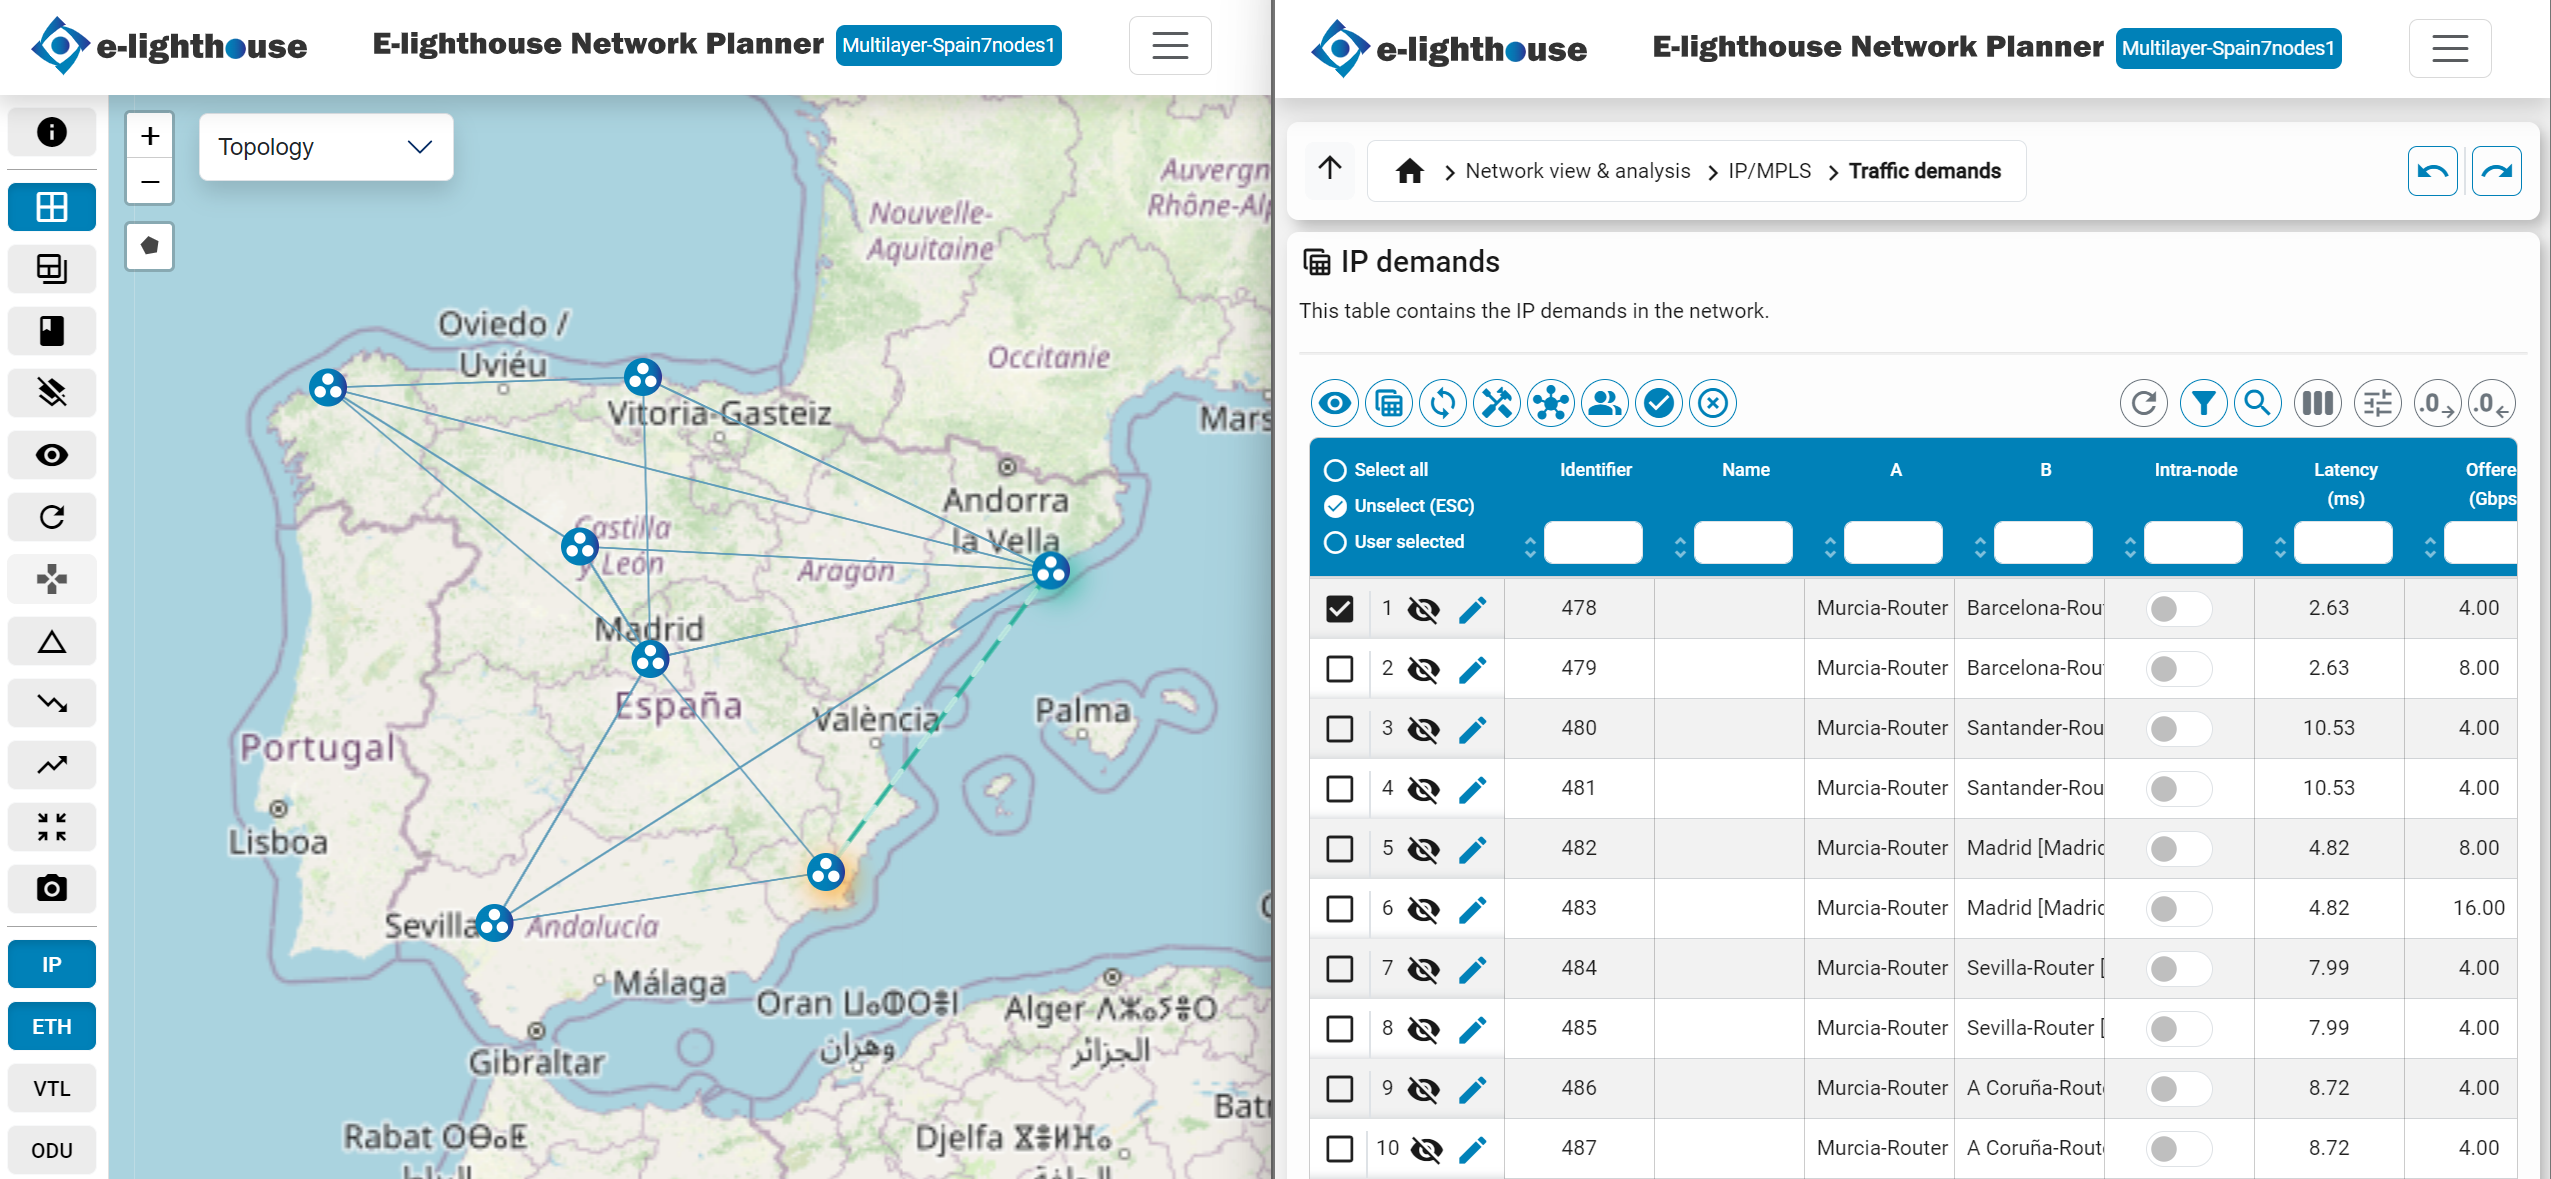
- Topology window. Shows the network topology on a canvas, allows to manipulate the network representation in different forms, and provides access to other functionalities via their buttons.
- Control window. Hosts tables and panels for network visualization and analysis, and gives access to network design and reporting functionalities.